Kubernetes
The purpose of this documentation is to deploy a sample application published via AWS ELB, that will be ratelimited at infrastructure level, thanks to the use the envoyproxy sidecar container, that will be in charge of contacting to a ratelimit service (limitador), that will allow the request (or not) if it is within the permitted limits.
There are mainly two recommended way of using limitador in kubernetes:
- There is an ingress based on envoyproxy that contacts with limitador ratelimit service before forwarding (or not) the request to the application
- There is an envoyproxy sidecar container living in the application pod that contacts with limitador ratelimit service before forwarding (or not) the request to the main application container in the same pod
In this example it will be described the second scenario (where there is an application with an envoyproxy sidecar container contacting to limitador service).
NOTE
If you don't want to manually manage the sidecar container definitions on your deployments (harcoding the container spec, loading the envoy configuration from a configmap that requires a pod restart to reload possibles configuration changes...), you can use marin3r, a light weight envoy control plane that allows you to inject envoyproxy sidecar containers and dynamically consume configs from Kubernetes custom resources.
This is the network diagram of the deployed example:

Components
In order to that that ratelimit test, you need to deploy a few components. Some of them are mandatory, and a few are optional:
Mandatory
- Application (a sample application deployment called
kuard): - App has an
envoyproxysidecar container with its configuration file in a configmap, composed by:- Cluster
kuardpoints to main application container (127.0.0.1:8080) - Cluster
kuard_ratelimitpoints to limitador headless service (limitador:8081) - Listener HTTP points to envoyproxy sidecar (
0.0.0.0:38080) - When envoy contacts with the ratelimit service, you can define a timeout, and if there is no response within that timeout (because ratelimit is overloaded taking more time to process the request, or because rateliit service is down), you can choose from envoy to deny the request or pass it to the application. In this case, there is set a 1s timeout, and if there is no answer in this 1 second, request is passed to the application (
failure_mode_deny: false), so we guarantee that the maximum overhead added by a non working ratelimit service is 1 extra second to the final response time.
- Cluster
-
App service published with
type: LoadBalancer, which creates a AWS ELB. This service has an annotation to enable proxy protocol on the AWS Load balancer in order to be able to keep the real client IP at envoy level (instead of the k8s node private IP), so it can be used to ratelimit per each real client IP if desired. -
Ratelimit application (a deployment called
limitador): - Limitador Configmap with limits definition (1000 rps per hostname).
-
Limitador headless service published on
limitador:8081. It is important to use a headless service in order to balance correctly the traffic between limitador pods, otherwise GRPC connections are not well balanced. -
Redis database to persist ratelimit configuration:
- Redis service
- Redis statefulset with a persistent volume
Optional
- Centos pod:
- Used to executed
heytool benchmarks from the cluster, so we ensure network latency does not affect the results. Actually, to achieve better results, this pod should be on another cluster (to not share the network between client and network) and be placed on the same Region (to reduce latency). The client could be a bottle neck for the performance test. - This centos is going to public AWS ELB to access the app, so simulating it is a normal client from the same Region
- Prometheus monitoring and grafana dashboard resources
K8s deployment
-
Deploy the redis instance that will keep the limits for different limitador pods:
-
Deploy limitador application. It is important to create the configmap with limitador limits before the deployment, in order to load it from limitador pods. At the moment, if you update the limits configmap you need to restart the pods. Additionally, limitador has an API in order to load limits dynamically, but for simplicity for this test a configmap has been used:
-
Deploy sample kuard application with the envoyproxy sidecar container (if you do any change on the envoy configmap, remember you need to restart app pods in order to reload the config):
-
At this point you shoud see all pods running, and kuard pods should have 2 containers (the main kuard container, and the envoyproxy sidecar container):
-
Now you should be able to access to kuard application using the load balancer DNS name:
-
If you go to the browser and paste the
EXTERNAL-IP, your request will follow the next workflow: - The requests will go from your local machine through internet to the public AWS ELB where the app is published
- Then it will go to the
NodePortof your k8s cluster nodes - Once on a k8s node, it will go to kuard
ServiceVirtual IP, and will arrive to an envoyproxy sidecar container inside kuard pod - Envoyproxy sidecar container will contact with limitador headless
Service, to authorize the requests or not:- If the request is authorized (within the configured limits), it will send the request to the app container (
0.0.0.0:8080) in the same pod, and request will end up with aHTTP 200response - If the request is limited (beyond the limits), request will end up with
HTTP 429response
- If the request is authorized (within the configured limits), it will send the request to the app container (
Monitoring
Both envoyproxy sidecar and limitador applications include built-in prometheus metrics.
Prometheus
In order to scrape that metrics within a prometheus-operator deployed in the cluster, you need to create a PodMonitor resource for every application:
Grafana dashboard
Then, if you have grafana deployed in the cluster, you can import a Kuadrant Limitador grafana dashboard that we have prepared, which includes: - Kuard envoyproxy sidecar metrics (globally and per pod) - Limitador metrics (globally and per pod) - And for every deployed component (limitador, kuard, redis): - Number of pods (total, available, unavaible, pod restarts...) - CPU usage per pod - Memory usage per pod - Network usage per pod
Benchmarking
- In order to check that the ratelimit is working as expected, you can use any benchmarking tool, like hey
- You can use if you want a centos pod (better to create it on a different custer within the same Region):
- Connect to centos pod:
- And install
heywith: - Now you can execute the benchmark using the following escenario:
| Item | Value |
|---|---|
| Target | AWS ELB DNS Name |
| App pods | 2 |
| Limitador pods | 2 |
| Limits | 1.000 rps per hostname |
| Hey duration | 1 minute |
| Hey Traffic | -c 60 -q 20 (around 1.200 rps) |
- Theoretically:
- It should let pass 1.000 requests, and limit 200 requests per second
- It should let pass 60 * 1.000 = 60.0000 requests, and limit 60 * 200 = 12.000 requests per minute
- Each limitador pod should handle half of the traffic (500 rps OK, and 200 rps limited)
[root@centos /]# hey -z 60s -c 60 -q 20 "http://a96d5449fbc3f4cd892e15e5b36cde48-457963259.us-east-1.elb.amazonaws.com"

Summary:
  Total:    60.0131 secs
  Slowest:  0.1028 secs
  Fastest:  0.0023 secs
  Average:  0.0075 secs
  Requests/sec: 1199.3721

  Total data:   106581650 bytes
  Size/request: 1480 bytes

Response time histogram:
  0.002 [1] |
  0.012 [70626] |■■■■■■■■■■■■■■■■■■■■■■■■■■■■■■■■■■■■■■■■
  0.022 [1291]  |■
  0.032 [0] |
  0.043 [0] |
  0.053 [0] |
  0.063 [0] |
  0.073 [0] |
  0.083 [0] |
  0.093 [23]    |
  0.103 [37]    |


Latency distribution:
  10% in 0.0053 secs
  25% in 0.0063 secs
  50% in 0.0073 secs
  75% in 0.0085 secs
  90% in 0.0096 secs
  95% in 0.0102 secs
  99% in 0.0139 secs

Details (average, fastest, slowest):
  DNS+dialup:   0.0001 secs, 0.0023 secs, 0.1028 secs
  DNS-lookup:   0.0001 secs, 0.0000 secs, 0.0711 secs
  req write:    0.0000 secs, 0.0000 secs, 0.0014 secs
  resp wait:    0.0074 secs, 0.0023 secs, 0.0303 secs
  resp read:    0.0000 secs, 0.0000 secs, 0.0049 secs

Status code distribution:
  [200] 60046 responses
  [429] 11932 responses
-
We can see that:
- Client could send 1192.2171rps (about 1200rps)
- 60046 requests (about 60000) were OK (HTTP 200)
- 11932 requests (about 12000) were limited (HTTP 429)
- Average latency (since the request goes out from the client to AWS ELB, k8s node, envoyproxy container, limitador+redis, kuar app container) is 10ms
-
In addition, if we do a longer test with 5 minutes traffic for example, you can check with the grafana dashboard how these requests are processed by envoyproxy sidecar container of kuard pods and limitador pods:
- Kuard Envoyproxy Sidecar Metrics:
- Globally it handles around 1200rps: it permits around 1krps and limits around 200rps
- Each envoyproxy sidecar of each kuard pod handles around half of the traffic: it permits around 500rps and limits around 100rps. The balance between pods is not 100% perfect, caused by random iptables forwarding when using a k8s service

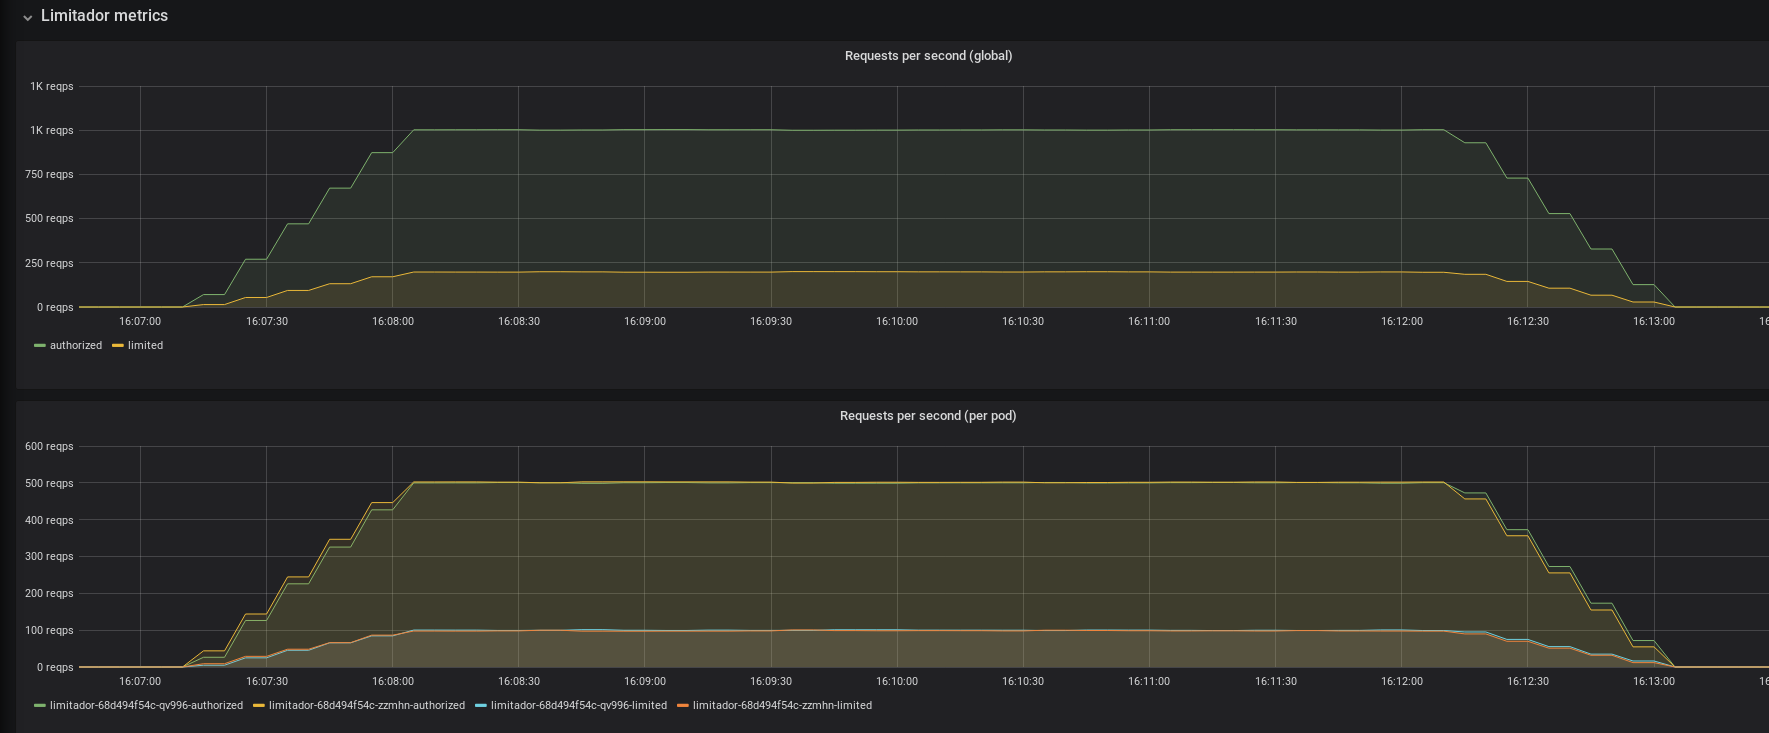
- Limitador Metrics:
- Globally it handles around 1200rps: it permits around 1krps and limits around 200rps
- Each limitador pod handles around half of the traffic: it permits around 500rps and limits around 100rps. The balance between pods is perfect thanks to using a headless service with GRPC connections
- Kuard Envoyproxy Sidecar Metrics: